
Labour productivity is a hot topic to be researched globally. Output / GDP / Value Added per employees usually used as the indicator of labour productivity. The performance of JobStock® will be measured as numbers of advertised job advertisement and numbers of job positions advertised in the portal annually (independent variable). The analysis will be carried out by using Ordinary Least Square (OSL) Estimation Method. The 10 years time series data as shown in table below.
| No | Year | Labour Productivity'000 (GDP per Employee) | Advertised job advertisement | Numbers of Job Positions Advertised |
|---|---|---|---|---|
| 1 | 2011 | 87.61 | 1,193 | 3,158 |
| 2 | 2012 | 82.19 | 2,241 | 4,358 |
| 3 | 2013 | 82.53 | 2,835 | 5,235 |
| 4 | 2014 | 83.04 | 3,000 | 5,735 |
| 5 | 2015 | 87.31 | 3,565 | 6,803 |
| 6 | 2016 | 99.67 | 3,590 | 6,766 |
| 7 | 2017 | 101.40 | 3,839 | 7,034 |
| 8 | 2018 | 101.74 | 4,041 | 7,060 |
| 9 | 2019 | 114.76 | 4,633 | 7,976 |
| 10 | 2020 | 100.70 | 3,787 | 6,189 |
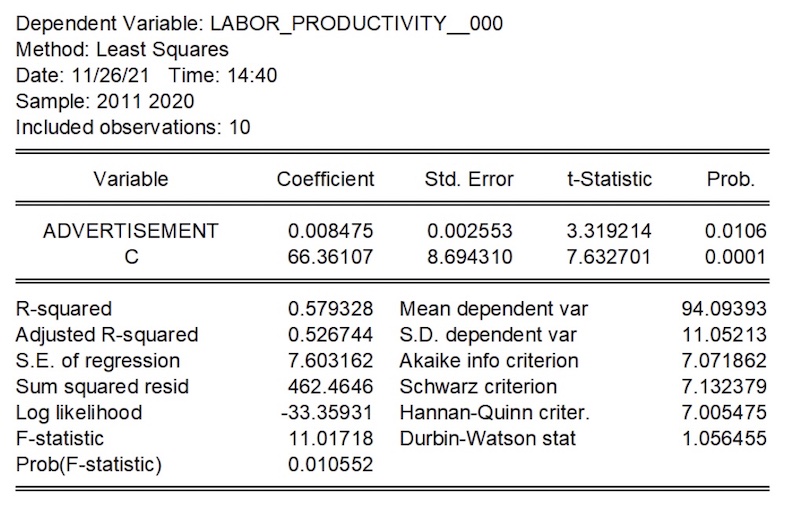
The relationship between advertised job advertisement and labour productivity in Sarawak can be transformed into equation below:
As shown in table above, the P-values of the independent variable is 0.0106 (significant if < 0.05) and correlation coefficient value is 0.008. It shows that numbers of advertised job advertisement in JobStock® significantly positive impact numbers of employed labour force in Sarawak and the increment in numbers of advertised job advertisement in JobStock® will increase labour productivity in Sarawak as much as 0.008 times.
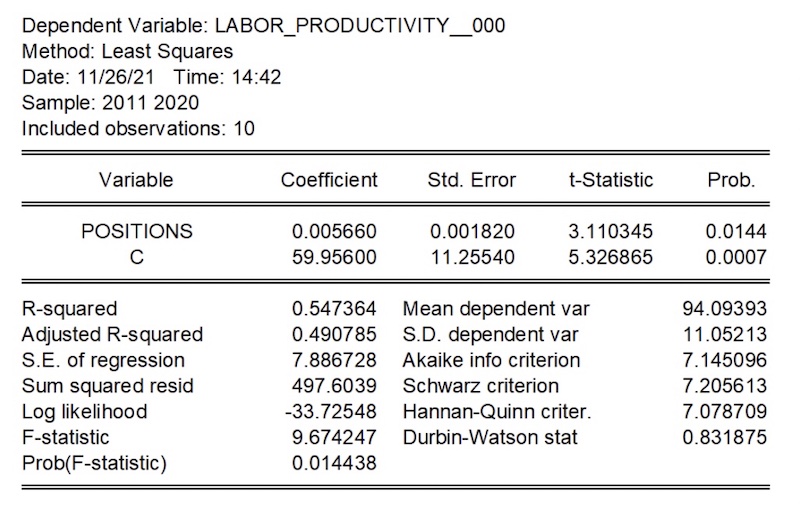
The relationship between advertised job position and labour productivity in Sarawak can be transformed into equation below:
As shown in table above, the P-values of the independent variable is 0.0144 (significant if < 0.05) and correlation coefficient value is 0.0056. It shows that numbers of advertised job position in JobStock® significantly positive impact numbers of employed labour force in Sarawak and the increment in numbers of advertised job advertisement in JobStock® will increase labour productivity in Sarawak as much as 0.0056 times.